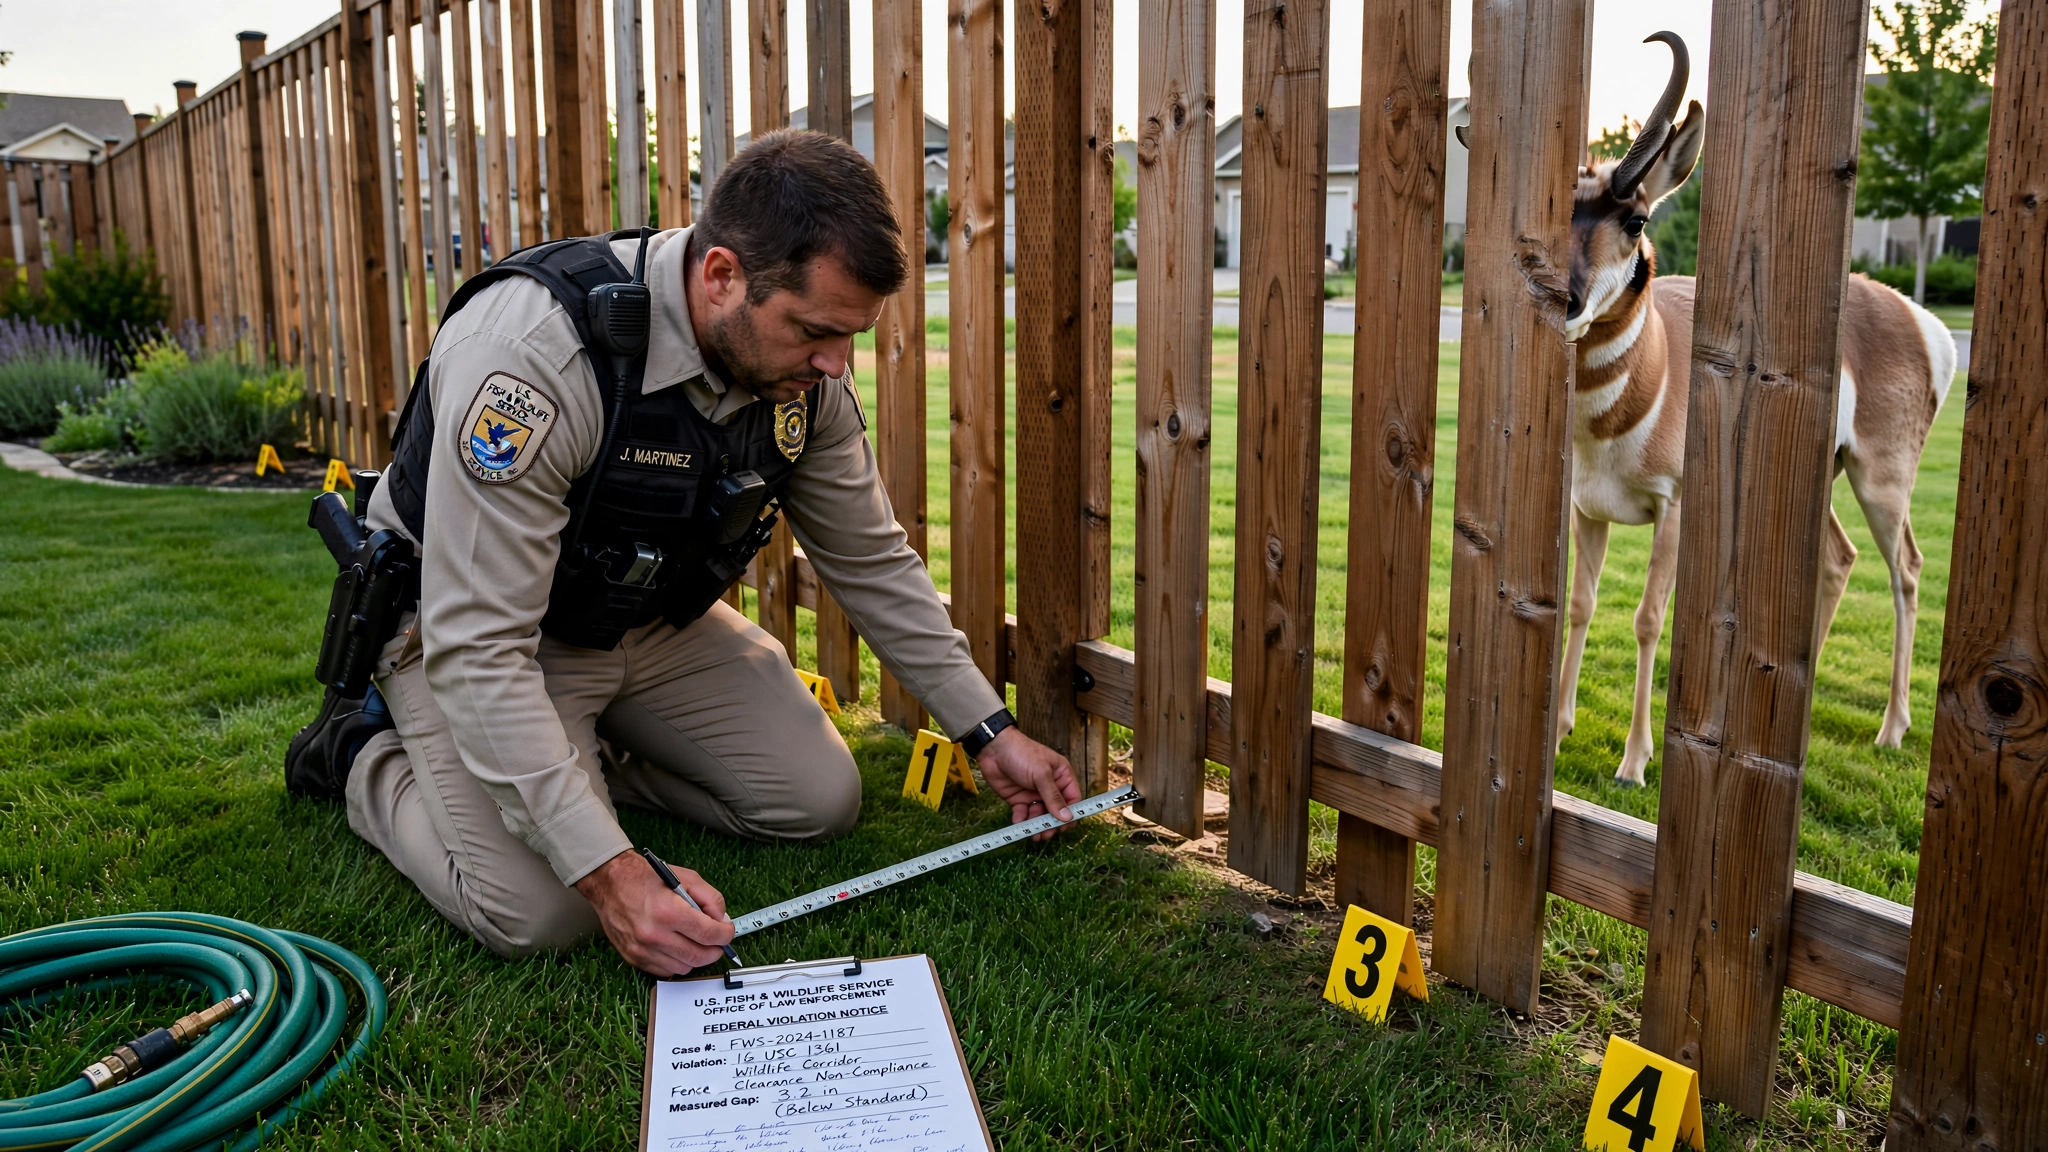
I. The Statutory Prohibition
The Endangered Species Act of 1973, signed into law by President Richard Nixon on December 28, 1973, is widely regarded as the most powerful environmental statute in the United States. Its central prohibition is found at Section 9(a)(1)(B), codified at 16 U.S.C. § 1538(a)(1)(B), which provides that it is unlawful for any person to “take any such species within the United States or the territorial sea of the United States.”1
The statute defines “take” at Section 3(19), codified at 16 U.S.C. § 1532(19), to mean “to harass, harm, pursue, hunt, shoot, wound, kill, trap, capture, or collect, or to attempt to engage in any such conduct.”2 The penalty for a knowing violation of Section 9 is a fine of up to $50,000 and imprisonment for up to one year, pursuant to 16 U.S.C. § 1540(b)(1). Civil penalties of up to $25,000 per violation are available under § 1540(a)(1).
The statute does not limit its application to intentional killing. It does not require that the person committing the take be aware they are doing so. It does not require that the person be engaged in commercial activity, industrial development, or any activity more dramatic than erecting a physical structure on their own property. It requires only that a person “take” a listed species, and the statutory definition of “take” includes “harm.”
II. The Regulatory Definition of Harm
In 1975, the Secretary of the Interior promulgated a regulation defining “harm” for purposes of the ESA’s take prohibition. The current version of this regulation, codified at 50 CFR § 17.3, provides that “harm” in the definition of “take” means “an act which actually kills or injures wildlife. Such act may include significant habitat modification or degradation where it actually kills or injures wildlife by significantly impairing essential behavioral patterns, including breeding, feeding, or sheltering.”3
This definition establishes three elements. First, the act must actually kill or injure wildlife. Second, the act may consist of habitat modification or degradation. Third, the habitat modification must significantly impair essential behavioral patterns, specifically including breeding, feeding, or sheltering. All three elements are conjunctive. All three are satisfied by a fence.
III. The Supreme Court’s Endorsement
The validity of this regulatory definition was challenged and upheld by the Supreme Court in Babbitt v. Sweet Home Chapter of Communities for a Great Oregon, 515 U.S. 687 (1995).4 The respondents, representing timber industry interests, argued that Congress intended “take” to encompass only the direct application of force against an animal, not habitat modification. The Court disagreed, 6–3.
Writing for the majority, Justice Stevens identified three textual reasons for upholding the Secretary’s interpretation. First, the ordinary meaning of “harm” naturally encompasses habitat modification that results in actual injury or death. Second, the ESA’s broad purpose of providing comprehensive protection for endangered and threatened species supports an expansive reading. Third, Congress had amended the ESA in 1982 to add the incidental take permit provision at Section 10(a)(1)(B), which would be largely superfluous if “take” did not already reach habitat modification, since the legislative history of the 1982 amendment explicitly referenced habitat modification as a form of take.5
Justice O’Connor, concurring, emphasized that the regulation’s requirement of “actual” injury to identifiable wildlife provided a meaningful limiting principle. Justice Scalia, dissenting, argued that “harm” should be read as applying only to direct injury, invoking the noscitur a sociis canon. The majority’s holding stands. Habitat modification that actually kills or injures wildlife is a “take” under the ESA. This has been the law for thirty-one years.
IV. The Fence Census
The precise quantity of fencing in the United States is unknown. This is itself remarkable. The nation maintains detailed inventories of roads, bridges, pipelines, electrical transmission lines, railroad track, and fiber optic cable. It does not maintain a national inventory of fences.
The data that exist are fragmentary but alarming. The National Wildlife Federation has estimated that there are more than 620,000 miles of fencing across the western United States alone.6 A 2013 study published in PLOS ONE modeled fence locations in just the Hi-Line region of Montana, a single subregion of a single state, and predicted 263,308 kilometers of fencing, with a mean density of 2.37 kilometers of fence per square kilometer.7 A UC Berkeley research team studying the Greater Yellowstone Ecosystem documented nearly 3,800 miles of fencing in their study area, noting that this was nearly twice the length of the U.S.-Mexico border.8 A National Geographic investigation reported that researchers studying the northern sagebrush steppe in Montana, Alberta, and Saskatchewan found enough fence in their study area to wrap around the planet eight times.9
These figures account only for agricultural and rangeland fencing. They do not include the approximately 65 million single-family homes in the United States that have some form of perimeter fencing, the chain-link fences enclosing 16,000 public school campuses, the security fencing around 45,000 industrial facilities, or the decorative fencing adorning 22 million suburban subdivisions. The Bureau of Land Management alone constructed 51,000 kilometers of fencing on federally managed land between 1962 and 1997, adding approximately 1,000 kilometers per year through 2002.10
No one has totaled these figures. We attempted to do so. We stopped when the number exceeded the circumference of the Earth by two orders of magnitude.
V. The Kill Rate
In 2005, Justin Harrington, a graduate student at Utah State University working under the supervision of Dr. Michael Conover, completed a two-season field study of wildlife mortality along more than 600 miles of fencing in the rangelands of northeastern Utah and northwestern Colorado. The methodology was direct: Harrington and his team repeatedly drove and walked fence lines and counted the carcasses of mule deer, pronghorn, and elk caught in fences or found dead beside them. The results were published in the Wildlife Society Bulletin in 2006.11
The study found an average annual direct mortality rate of 0.25 ungulate deaths per kilometer of fence. Converted to miles, this means one ungulate is found tangled in fencing for every 2.5 miles of fence, every year. But direct entanglement accounted for only 33 percent of fence-related mortality. Indirect mortality, defined as carcasses found within ten meters of a fence but not caught in the wires, constituted the remaining 66 percent. When indirect mortality was included, the rate rose to one ungulate death for every 1.2 miles of fence annually.12
Juvenile animals were eight times more likely to die in fences than adults. Mortalities peaked in August, when fawns were weaned and began attempting fence crossings independently. Woven-wire fence topped with a single strand of barbed wire was the most lethal configuration, as animals’ legs became trapped between the rigid woven wire and the barbed strand. Seventy percent of all mortalities occurred on fences higher than 40 inches.13
Apply the conservative estimate of one death per 2.5 miles to the National Wildlife Federation’s figure of 620,000 miles of western fencing. The result is 248,000 ungulate deaths per year from fencing in the western United States alone. This figure does not include birds, reptiles, amphibians, or small mammals. It does not include the eastern United States. It does not include residential, commercial, or industrial fencing. It counts only hoofed animals caught in ranch fences west of the Mississippi.
VI. Behavioral Impairment as Harm
The regulation at 50 CFR § 17.3 does not require that the habitat modification kill wildlife. It requires only that it “significantly impair essential behavioral patterns, including breeding, feeding, or sheltering.” The evidence that fencing impairs these behavioral patterns is not speculative. It has been measured with GPS collars and published in peer-reviewed journals.
In 2021, Wenjing Xu and colleagues at the University of California, Berkeley published a study in the Journal of Applied Ecology that used GPS tracking data from 24 tagged female mule deer and 24 pronghorn to quantify the effects of fencing on migratory ungulate movement in the Greater Yellowstone Ecosystem. The study found that pronghorn encountered fences an average of 248 times per year. Mule deer encountered fences 119 times per year. Approximately 40 percent of these fence encounters resulted in a measurable change in the animals’ behavior.14
Forty percent of 248 annual encounters means that each individual pronghorn has its behavior altered by fencing approximately 99 times per year. Each alteration involves the animal changing its trajectory, delaying its movement, or abandoning its intended path entirely. For an animal whose essential behavioral patterns include seasonal migration over corridors exceeding 100 miles, as documented by the Wyoming Migration Initiative, this is not an incidental nuisance. It is a systematic impairment of breeding, feeding, and sheltering behavior.
The pronghorn is particularly instructive because of a well-documented behavioral constraint. Unlike mule deer, which can clear a standard four-strand barbed-wire fence with a leap, pronghorn evolved on the open grasslands of North America and adapted to evade predators through speed rather than jumping. Pronghorn are the fastest land animal in the Western Hemisphere, capable of sustaining speeds of 55 miles per hour, but they are poor jumpers. Their primary strategy for crossing fences is to crawl under the bottom wire, a maneuver that requires a gap of at least 16 inches between the wire and the ground.15 When the bottom wire is too low, the pronghorn does not jump. It turns around. It is, in evolutionary terms, a sprinter trapped by hurdles.
A 2025 study led by Ellen Aikens at the University of Wyoming examined pronghorn mortality during a severe winter in the Red Desert and found that human-made barriers, principally fences, combined with deep snow to produce a 3.7-fold increase in pronghorn mortality compared to previous years. GPS data showed pronghorn tracing fence lines for 20 miles without finding a crossing point. Others paralleled Interstate 80 for 50 miles searching for a gap. By February, animals that had been blocked by fences were mired in snow, their fat reserves exhausted.16
VII. The Avian Compounding Factor
The analysis to this point has addressed only ungulates. Fences also kill birds, and the legal implications are compounded by the Migratory Bird Treaty Act of 1918, codified at 16 U.S.C. §§ 703–712, which makes it unlawful to “kill” or “take” any migratory bird without authorization.17
Greater sage-grouse, a candidate for ESA listing whose conservation has consumed hundreds of millions of dollars in federal and state expenditures, are killed by fence collisions during the breeding season when they fly low over sagebrush rangeland toward leks, their communal mating grounds. Research by Brian Stevens, published through the U.S. Geological Survey, documented that sage-grouse fence collisions during the breeding season were “relatively common” and that proximity to a lek was the primary predictor of collision risk.18 A two-year study funded by the Natural Resources Conservation Service found 64 confirmed sage-grouse fence collisions in a single Wyoming county, and determined that fence markers reduced collision probability by approximately 58 percent, confirming both the magnitude of the problem and its preventability.19
The density of fencing in sagebrush country has increased dramatically over the last fifty years. BLM data show 51,000 kilometers of new fencing constructed on federal land alone between 1962 and 1997.20 Each new fence is a new obstacle in the flight path of a bird that has not evolved to detect thin wires at dawn. The fence does not have to be in sage-grouse habitat to kill sage-grouse. It merely has to exist between the bird and the lek.
VIII. The Incidental Take Permit Gap
Congress was not unaware that lawful activities could incidentally result in the taking of listed species. In 1982, it amended the ESA to add Section 10(a)(1)(B), codified at 16 U.S.C. § 1539(a)(1)(B), which authorizes the Secretary of the Interior to issue permits for the incidental take of listed species, provided that the applicant submits a habitat conservation plan (HCP) specifying the impact of the taking, the steps to minimize and mitigate such impacts, the funding available to implement those steps, and the alternatives considered and rejected.21
The U.S. Fish and Wildlife Service has issued incidental take permits for an extraordinarily wide range of activities. Wind energy companies receive them for turbines that may strike bald eagles. Irrigation districts receive them for water diversions that may strand salmon. Municipal governments receive them for development projects that may disturb fairy shrimp. The Building Industry Association of Superior California litigated the application of the ESA to housing developments that modified the habitat of the vernal pool fairy shrimp, and the court held that landowners whose developments modified fairy shrimp habitat were “directly regulated by the listing” and required an incidental take permit.22
A housing development that fills a vernal pool requires a permit. A six-foot cedar fence that bisects a wildlife corridor does not. The fairy shrimp is a half-inch crustacean. The pronghorn is a 130-pound ungulate that has migrated the same route for 6,000 years. The regulatory apparatus has identified the threat to the shrimp. It has not identified the fence.
The U.S. Fish and Wildlife Service publishes annual summaries of incidental take permits issued under Section 10(a)(1)(B). The Federal Register notices for calendar years 2022 and 2023 list permits for activities including timber harvesting, military base operations, highway construction, and energy development.23 Not one permit was issued for the installation of residential, agricultural, or commercial fencing. This is not because fencing does not take listed species. The peer-reviewed literature documents that it does. It is because no one has applied.
IX. The Scope of the Violation
The ESA currently protects 1,682 species as endangered or threatened within the United States, according to the U.S. Fish and Wildlife Service’s Environmental Conservation Online System.24 These species occupy designated critical habitats spanning millions of acres. The ranges of listed species overlap with residential development across every state in the nation. The rusty patched bumble bee is listed as endangered in 13 states. The northern long-eared bat is listed as endangered in 37 states. The monarch butterfly, proposed for listing, migrates through all 48 contiguous states.
A residential fence in suburban Phoenix sits within the range of the Sonoran pronghorn, listed as endangered. A residential fence in suburban Atlanta sits within the range of 23 listed species. A residential fence in the suburbs of any city within the Greater Yellowstone Ecosystem interrupts the longest remaining ungulate migration corridors in North America. Each of these fences modifies habitat. Each modification impairs behavioral patterns. Each impairment can be documented with the same GPS collar technology that UC Berkeley used to count 248 fence encounters per pronghorn per year.
The civil penalty for an unauthorized take is up to $25,000 per violation under 16 U.S.C. § 1540(a)(1). If a single residential fence causes one take of one listed species per year, the annual liability per homeowner is $25,000. If fencing nationwide causes 248,000 ungulate deaths per year, as the Harrington and Conover data suggest for the western United States alone, the aggregate annual civil liability is $6.2 billion. This figure does not include birds, reptiles, amphibians, or invertebrates. It does not include behavioral impairment that does not result in death but constitutes “harm” under the regulation. It does not include the eastern half of the country.
X. The Enforcement Arithmetic
The U.S. Fish and Wildlife Service’s Office of Law Enforcement employs approximately 250 special agents to enforce all federal wildlife protection laws across the entire United States, including the ESA, the MBTA, the Lacey Act, and CITES.25 Two hundred and fifty agents. Tens of millions of fences.
If each enforcement action, from initial inspection through notice of violation to resolution, required one agent-day of effort, and if the Service dedicated every agent exclusively to fence enforcement for 250 working days per year, the annual processing capacity would be 62,500 cases. At this rate, the backlog of existing residential fences alone would take approximately one thousand years to process. The fences would continue to be built during the processing period. The backlog would grow.
The incidental take permit process is equally unequal to the task. The HCP required for each permit must include, at minimum, an assessment of the impact on each affected species, a mitigation plan, a funding mechanism, and an analysis of alternatives. The average HCP for a major development project takes two to five years to prepare and costs hundreds of thousands of dollars. For a suburban homeowner installing a six-foot privacy fence at a cost of $4,000, the permit process would cost more than the fence, take longer than the mortgage, and require the retention of a wildlife biologist whose hourly rate exceeds the homeowner’s.
XI. The Constitutional Question
The application of the ESA’s take prohibition to private land use has generated significant constitutional litigation under the Takings Clause of the Fifth Amendment. In National Association of Home Builders v. Babbitt, 130 F.3d 1041 (D.C. Cir. 1997), the court upheld the application of the ESA to a county government’s hospital construction project that threatened the habitat of the Delhi Sands flower-loving fly, a listed species found on approximately 12 square miles of habitat in San Bernardino County, California.26
The court found that the Commerce Clause provided sufficient constitutional authority for the ESA to regulate purely local land use activities that affected listed species. Judge Wald, concurring, concluded that the loss of biodiversity had a substantial effect on interstate commerce. The hospital was not built. The fly was protected. The constitutional framework that authorized this result applies with identical force to a residential fence that fragments the habitat of any federally listed species on private land anywhere in the United States.
The county had resources to litigate. The homeowner installing a fence does not know there is anything to litigate. The fence goes up on a Tuesday. A pronghorn encounters it 248 times the following year. The homeowner receives no notice. The pronghorn files no complaint.
XII. Conclusion
The statutory text is unambiguous. Section 9 prohibits take. Section 3 defines take to include harm. The regulation at 50 CFR § 17.3 defines harm to include significant habitat modification that kills or injures wildlife by impairing essential behavioral patterns. The Supreme Court upheld this definition in 1995 by a vote of 6–3. The peer-reviewed literature documents that fencing kills wildlife, injures wildlife, and impairs the behavioral patterns of wildlife with a precision that can be expressed as a rate per mile per year.
There are at least 620,000 miles of fencing in the western United States. There are tens of millions of residential fences nationwide. Each one modifies habitat. Many of them overlap with the ranges of one or more of the 1,682 species protected by the ESA. Research from three universities has documented that fencing causes direct mortality, indirect mortality, and behavioral impairment at rates that far exceed the thresholds that have triggered enforcement action against other forms of habitat modification, from timber harvesting to hospital construction to irrigation management.
The U.S. Fish and Wildlife Service issues incidental take permits for wind turbines. It issues them for irrigation districts. It issues them for highway projects. It has never issued one for a fence. This is not because fences do not take listed species. The scientific evidence is unequivocal that they do. It is not because fences are exempt from the statute. The statute contains no exemption for structures made of wood, wire, or vinyl. It is not because the harm is minor. The harm is lethal, quantified, and published in the Wildlife Society Bulletin.
The Service has not issued a permit because no one has applied for one. No one has applied because no one has been told to apply. No one has been told to apply because the enforcement apparatus of the federal government, with its 250 agents covering 3.8 million square miles, has not yet identified the residential fence as the habitat modification device that the statute, the regulation, and the Supreme Court clearly indicate it is.
A six-foot cedar privacy fence from Home Depot costs $42 per linear foot, installed. An incidental take permit costs years and hundreds of thousands of dollars. One of these numbers determines what Americans build on their property. The other determines what happens to the wildlife that was using the property first.
The fence does not file an environmental impact statement. It does not submit a habitat conservation plan. It does not retain a wildlife biologist to survey for the presence of listed species within the construction footprint. It goes up on a Saturday morning with a post-hole digger and a level, and by Sunday afternoon the behavioral patterns of every animal that used to cross that piece of ground have been permanently modified.
The statute calls this harm. The regulation calls it harm. The Supreme Court calls it harm. The pronghorn, having encountered its 248th fence of the year, calls it nothing, because it is an ungulate and does not read the Federal Register.
Ergo.
Sources
- 16 U.S.C. § 1538(a)(1)(B), Endangered Species Act of 1973, § 9(a)(1)(B). law.cornell.edu ↑
- 16 U.S.C. § 1532(19), Endangered Species Act of 1973, § 3(19), definition of “take.” law.cornell.edu ↑
- 50 CFR § 17.3, Definition of “harm” in the definition of “take” under the Endangered Species Act. law.cornell.edu ↑
- Babbitt v. Sweet Home Chapter of Communities for a Great Oregon, 515 U.S. 687 (1995). supreme.justia.com ↑
- Babbitt v. Sweet Home, 515 U.S. at 700–704 (discussing legislative history of 1982 amendments and the incidental take permit provision). supreme.justia.com ↑
- National Wildlife Federation, “Reconnecting the Landscape for Wildlife: Fencing for Wildlife.” nwf.org ↑
- J.F. Jakes et al., “Modeling Fence Location and Density at a Regional Scale for Use in Wildlife Management,” PLOS ONE, vol. 8, no. 12, 2013, e83912. journals.plos.org ↑
- W. Xu et al., “Quantifying the Effects of Fences on Migratory Ungulates,” research summary, UC Berkeley, 2021. news.berkeley.edu ↑
- National Geographic, “Taking Down Old Fences to Help Migrating Wildlife,” 2021. nationalgeographic.com ↑
- J.W. Connelly et al., “Conservation Assessment of Greater Sage-Grouse and Sagebrush Habitats,” Western Association of Fish and Wildlife Agencies, 2004 (documenting 51,000 km of BLM fencing 1962–1997). ↑
- J.L. Harrington and M.R. Conover, “Characteristics of Ungulate Behavior and Mortality Associated with Wire Fences,” Wildlife Society Bulletin, vol. 34, no. 5, 2006, pp. 1295–1305. digitalcommons.usu.edu ↑
- Harrington and Conover (2006), at 1298–1299 (indirect mortality rates and comparison to direct entanglement). ↑
- Harrington and Conover (2006), at 1300–1302 (juvenile mortality rates, seasonal patterns, and lethal fence configurations). ↑
- W. Xu, L.C. Gigliotti, R. Royauté, H. Sawyer, and A.D. Middleton, “Fencing Amplifies Individual Differences in Movement with Implications on Survival for Two Migratory Ungulates,” Journal of Animal Ecology, vol. 92, 2023, pp. 677–689; see also W. Xu et al., “Quantifying the Effects of Fences,” Journal of Applied Ecology, 2021. news.berkeley.edu ↑
- J.A. Byers, American Pronghorn: Social Adaptations and the Ghosts of Predators Past, University of Chicago Press, 1997 (documenting pronghorn behavioral ecology and anti-predator adaptations). ↑
- E.P. Aikens et al., “Fences, Roads Foiled Pronghorn in Mass Winter Die-Off,” University of Wyoming, 2025. uwyo.edu ↑
- 16 U.S.C. § 703, Migratory Bird Treaty Act of 1918. law.cornell.edu ↑
- B.S. Stevens et al., “Sage-Grouse Fence Collision Risk,” U.S. Geological Survey, 2011–2012 (documenting collision frequency and risk factors near leks). ↑
- Bird Conservancy of the Rockies, “Evaluating Efficacy of Fence Markers in Reducing Greater Sage-Grouse Collisions with Fencing,” funded by NRCS Conservation Innovation Grant, Sublette County, Wyoming. wlfw.org ↑
- Connelly et al. (2004), cited above at note 10. ↑
- 16 U.S.C. § 1539(a)(1)(B), Endangered Species Act of 1973, § 10(a)(1)(B) (incidental take permits). law.cornell.edu ↑
- Building Industry Association of Superior California v. Babbitt, 979 F. Supp. 893 (D.D.C. 1997). law.justia.com ↑
- U.S. Fish and Wildlife Service, “Endangered Species Act; Issuance of Enhancement of Survival and Incidental Take Permits for Safe Harbor Agreements, Candidate Conservation Agreements, Conservation Plans, and Scientific Activities; January 1, 2023, Through December 31, 2023,” 89 Fed. Reg. 90718 (Nov. 18, 2024). regulations.justia.com ↑
- U.S. Fish and Wildlife Service, Environmental Conservation Online System (ECOS), Listed Species Summary. The ESA currently protects 1,682 species as endangered or threatened. ecos.fws.gov ↑
- U.S. Fish and Wildlife Service, Office of Law Enforcement. Agent staffing figures are approximate and reflect published workforce data. ↑
- National Association of Home Builders v. Babbitt, 130 F.3d 1041 (D.C. Cir. 1997). law.justia.com ↑